FSEconomy noob: most profitable assignments?
Not so long ago I’ve discovered FSEconomy, an economy meta-gate for flightsim fans. Despite of somewhat simplistic core mechanics and unfancy look, it has a very active community and a lot of depth to it. I’ve spent last couple of weeks reading the manual, watching community forums and doing some assignments in the game itself. And the more I was learning the more questions I was having: where to fly? Which aircraft? Rent, buy or lease? What about FBOs? How to find the best assignments? The manual and community forums have some advices, but I want more definite answers.
I mean, staying net positive is not so difficult, but being efficient is a whole another story. And I want to be as efficient as I can. Luckily, FSE offers a treasure trove of data to support decision-making in a form of data feeds. So I armed myself with Python and spend a few evenings getting some answers.
Since I’m still quite a noob in this game, my high-level plan is this:
- Find the most efficient way to build up initial capital without owning any assets.
- Find out which assets (FBOs or aircraft, which ones) would provide the most significant cost reduction.
- Invest and explore less involved methods of gaining revenue: rent/lease business, FBOs and all other fun.
Right now I’m barely at the first stage and my most burning question is:
What kind of assignments yield the biggest income per hour?
“Per hour” part is pretty important, since I have a fairly limited time I can spend flying, so I’d like to spend it as efficiently as I can.
There are two variables which directly influence how much you get paid for an assignment: distance and number of passengers in the assignment. The bigger the parameter, the higher the price. It is also important how many assignments you can complete at once. Finally, if we are concerned with time efficiency, we need to consider how much it takes to perform the flight.
From a reliable source I have obtained the formula used to calculate assignment pay:
![Pay(dis, ppl) = \left[\left(\frac{1}{ppl}\right)^{0.3} \cdot 500 \cdot \left(\frac{arctan(dis/25)}{arctan(1)}\right)\right] \cdot ppl \cdot dis](/files/fse_assignment_pay.png)
Looks complicated, so let’s graph it (assuming one passenger per assignment):
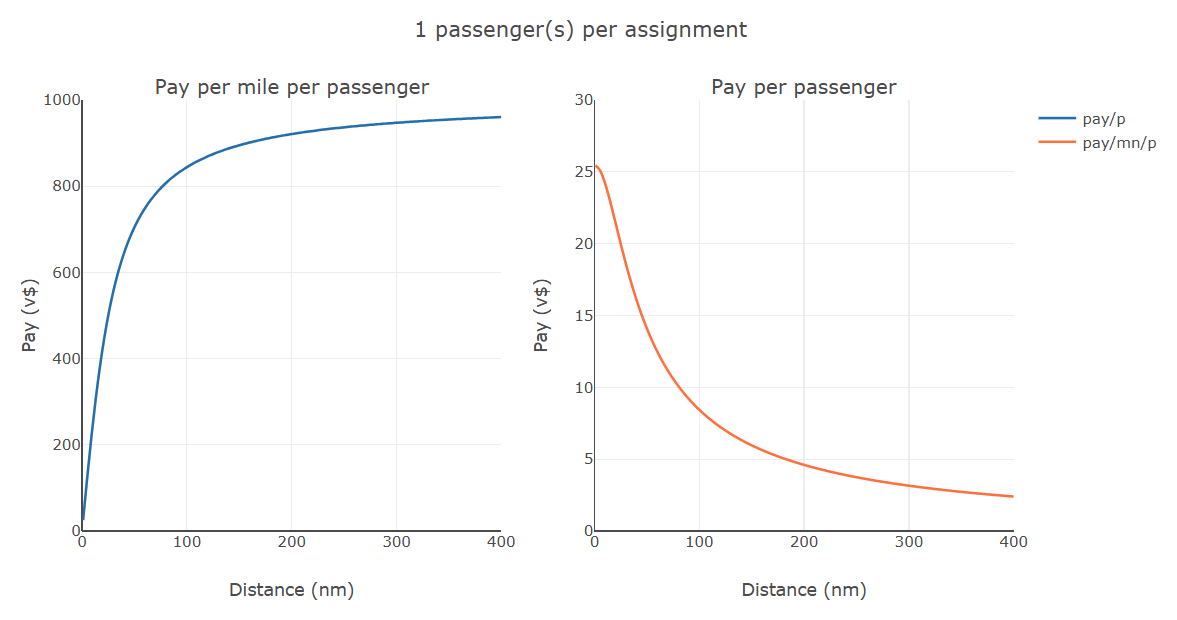
Graph on the left show pay depending on distance. The right one shows pay per mile depending on distance. It’s easy to see that pay per mile drops down quickly and, consequentially, total price tag levels out. It also shows that short-distance assignments are promising to be very profitable. But before we move on, let’s see what about number of passengers per assignment, for example with a group of 3 passengers:
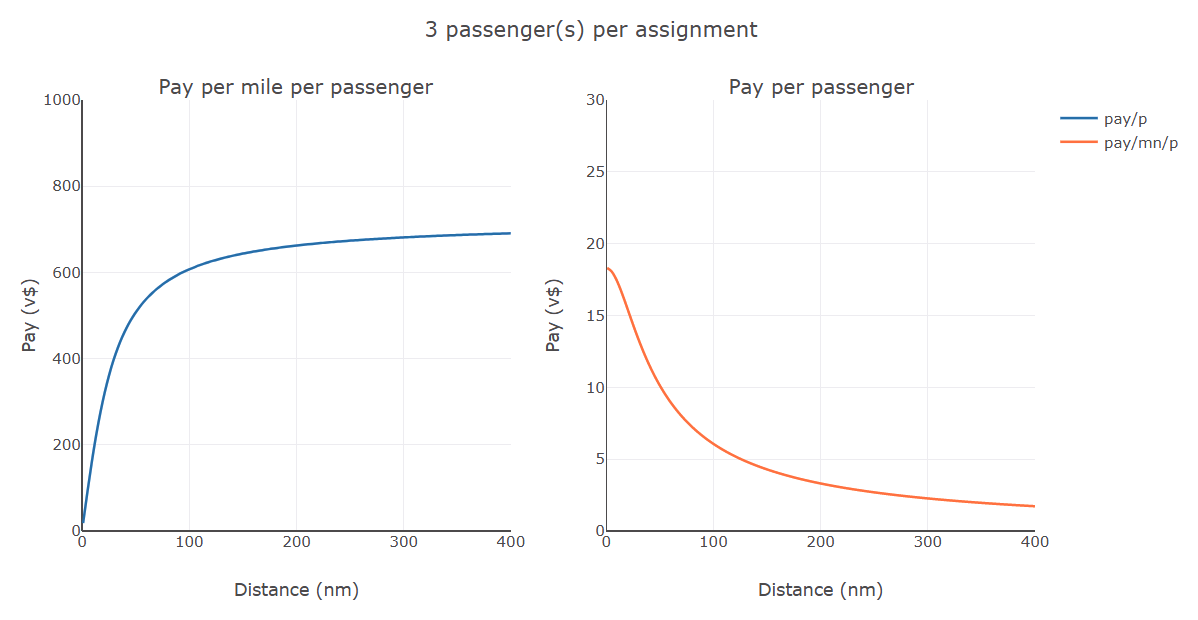
That doesn’t look very exciting. For example, price per passenger at 100 nm is ~30% lower. Well, this is not a revelation: FSE community found this out long time ago and experienced FBO network owners are setting up their gates to generate 1-person assignments only.
To summarize:
- One ticket per person!
- Flying very short haul looks profitable, long haul — not so much.
As a side note: I do have some thoughts on why it may make sense to allow small group assignments (perhaps 2-3 passengers), but that’s well beyond this post.
Guesstimating flight duration
This is a tricky part. In the simplest case we can assume that flight duration is just distance divided by aircraft cruise speed. However, this is not quite true in practice: climb and approach are flown at lower speeds, there’s also some overhead for loading/unloading and so on. For short-range flights it may make a big difference.
To make a more educated guess I decided to download flight records from FSE data feeds. Luckily, flight history is publicly available for every aircraft in the game by its registration number. It is also possible to obtain a complete list of aircrafts for a given make-model.
There’s only one technical problem: downloading flight records is roughly one request per aircraft, and there are thousands of those in the game. With existing rate limiting it takes a good while to get a complete dataset for even a single make-model. I focused my attention on a few models which seemed the most relevant to me:
- Cessna 172 Skyhawk and Beechcraft Baron 58 --- I know how to fly these two, so I’m naturally interested in them.
- Beechcraft King Air C90 and Cessna 208 Caravan --- those are larger workhorses used widely by richer FSE players.
- Eclipse 500 --- this is the only payware aircraft I currently own for X-Plane so why not. It’s not very popular or practical in FSE, though.
- Airbus A320 and Boeing 737-800 --- purely for shits and giggles. Player’s can’t actually own these types, but they can be used to fly all-in-one assignments.
With the data at hands, lets begin with verifying my initial hypothesis: dependency between flight time and distance is not quite linear. Here are some plots illustrating that for two arguably most popular airplane models in the game:
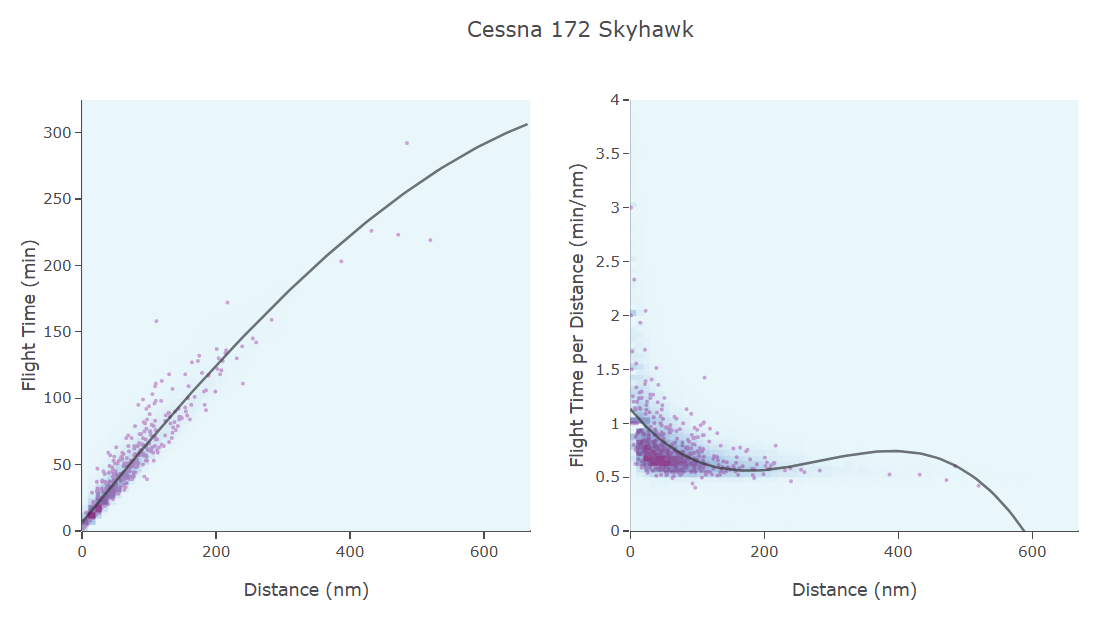
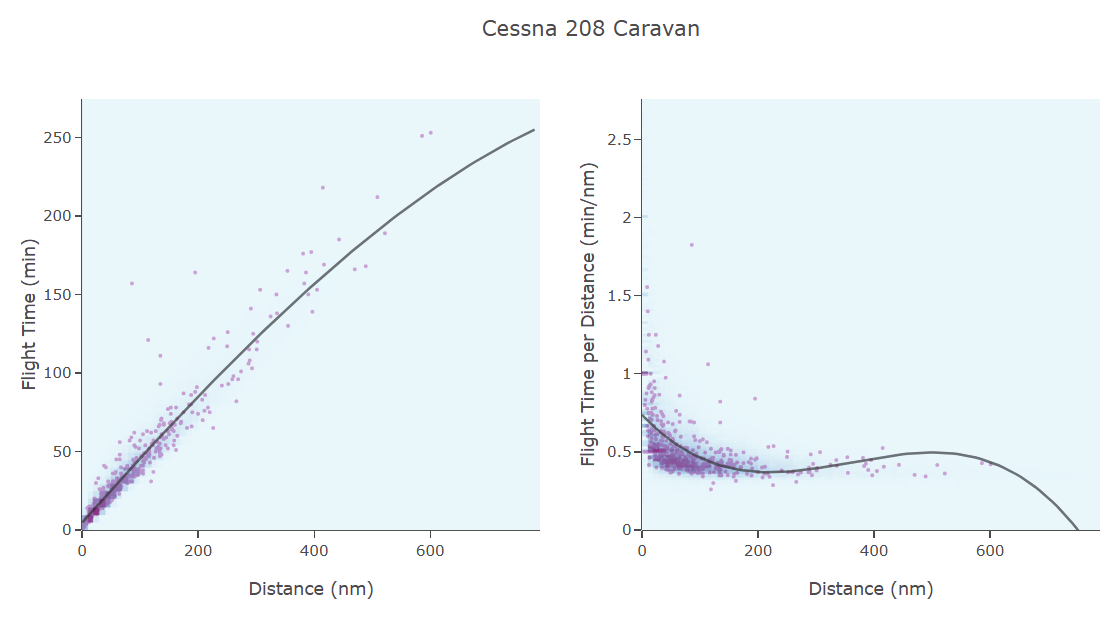
Purple dots on graphs are individual samples of flight records, background is a heatmap of unsampled data set, grey line is a result of approximating the function with polynomial regression. Left graph demonstrates flight time itself and right one — flight time per mile. It’s easy to see, especially on the left graph, that for shorter flights time per nm travelled is higher. It is also curious that vast majority of flights are no longer than 200nm.
Very well, that confirms the hypothesis. The simplistic model based on cruise speed is still useful to us as reference for sanity-checking statistical models. As for statistical models, we will look at two:
- Sample-based: for given distance dis estimated flight duration would be an average of flight time of all flight records with distance of dis ± 5nm.
- Polynomial regression: we will approximate the data set with a polynomial and use that to calculate flight time. Poor man’s machine learning :-)
Putting it all together: how far shall we fly?
Let’s formulate our final model, which will give us the much-desired answer. First of all, we will be making a number of assumptions:
- We only deal with single-person assignments. There may be reasons why someone would want to have a larger group assignments, but it’s mostly relevant to FBO owners, which I am not.
- Whatever plane we choose, we’re able to fill it to its full capacity. This is a bold assumption, but as beginners we will be probably doing the other way around: choosing the best fitting rentable plane for assignments at hands.
- There is set up/loading/unloading overhead for each flight. For more experienced pilots it would be lower, for noobs like myself — higher. My intuition tells me that 15 min overhead per flight is more or less accurate for an average FSE player.
- I’m not including any expenses into the model, since they can vary depending on flying own aircraft or renting or flying for a group.
With all that we arrive to a simple formula:
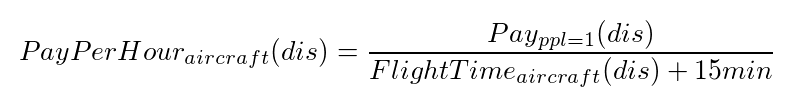
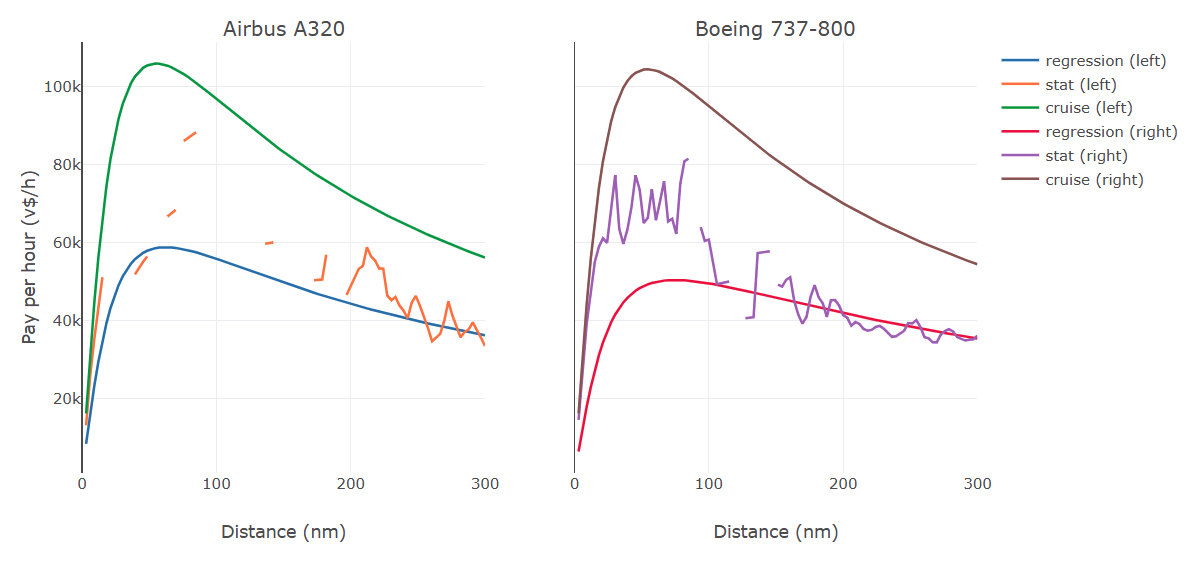
…where FlightTime can be calculated in three different ways I talked about above. And here are the graphs:
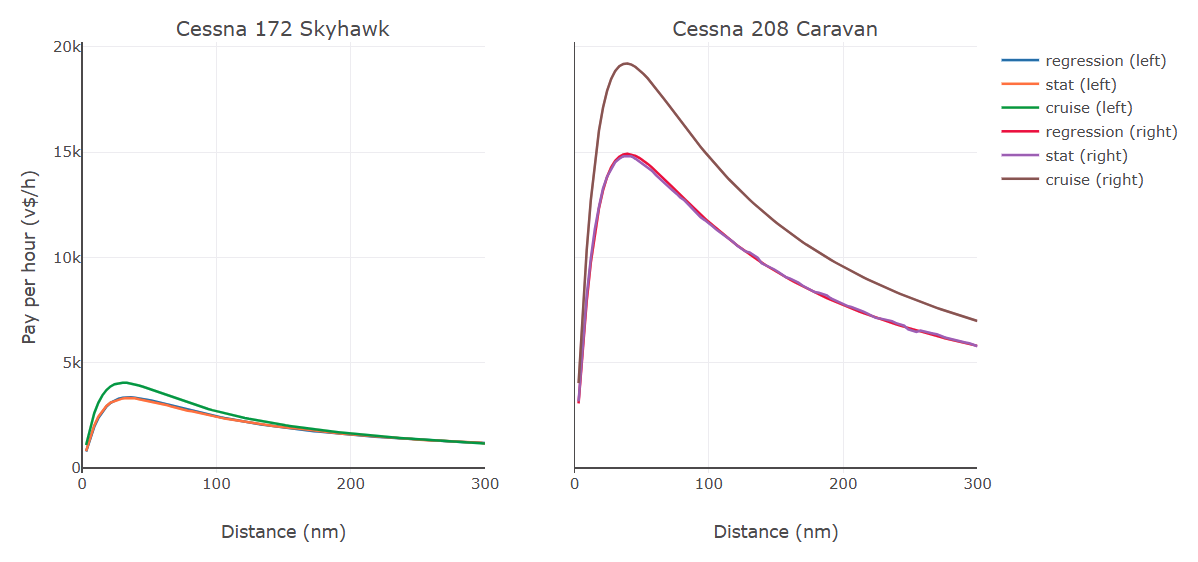
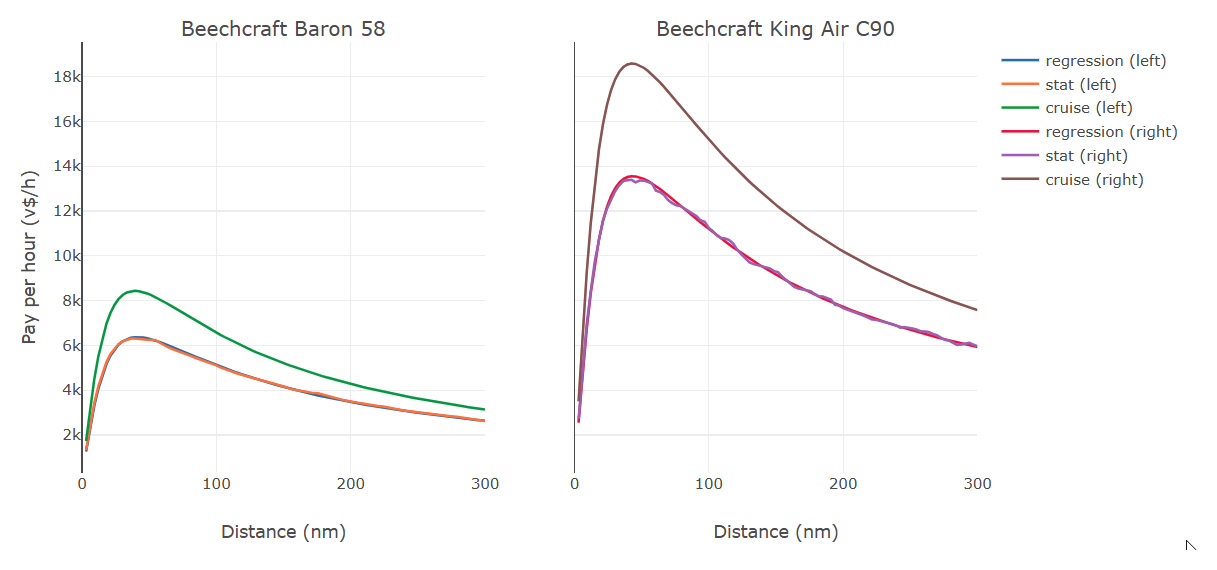
That leads us to our final conclusions:
- Flying very short haul is the most profitable activity. For smaller aircraft such as Cessna 172 it is as shot as 30 nm, for bigger ones it is shifted towards 40-50 nm, but still well under 100 nm.
- Flying in 50-80 nm range is still ok. There is actually a good profit potential if you’re ok with using time acceleration, but we will leave that research for another occasion.
- Cessna 208 is a great money maker if you can arrange a full load of assignments. And it is very popular for a reason.
- Our regression model performs very well! Results are nearly identical to sampling model, which is as “real data” as it gets. This is very good for future research, since it is much less computationally expensive.
Shits and giggles
If you’ve made it that far, you must be really interested in the subject. Well, I have a treat for you! The Jupyter notebook and data sets I used are available on GitHub. Also, by the virtue of mybinder.org the notebook is available to play with, enjoy!
Lastly, to put an end to Airbus vs Boeing debate. A320 is clearly more profitable to fly than B737: